Data visualisation
On these pages, we are presenting our data in a visualized format.
So far, the key indicators (area, producers, retail sales) crop data area available for organic agriculture worldwide, Africa and for the European Union.
Furthermore, area and producer data are available for Switzerland (in German).
How to use the Power BI interactive graphics on selected crops
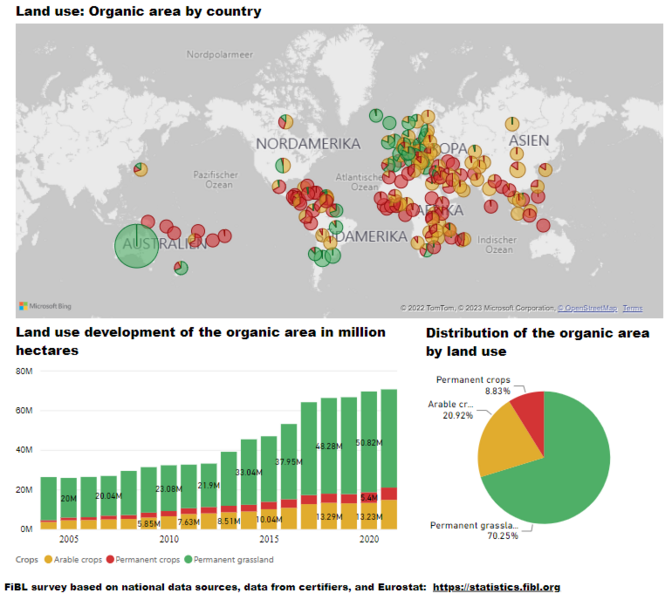
- For global data: The graphs show the global data for the selected crops/crop groups. Scroll down the bar charts in the upper row to see all countries sorted by area or area share.
- For regional data: Chose a region on the graphs with the continent (bottom right) to see:
- The continental map for the selected crop (country breakdown)
- The area for the selected crop by country (upper row, first bar chart)
- The organic area share for the selected crop (upper row, second bar chart)
- The development of the area for the selected crop (bottom left)
- The breakdown by crop, where relevant (bottom centre)
- For country data: Chose a country (on the map or in the bar charts with the countries sorted by area or by area share) to see
- The area for the selected crop on the map
- The area for the selected crop (upper row, first bar chart)
- The organic area share for the selected crop (upper row, second bar chart)
- The development of the area for the selected crop (bottom left)
- The breakdown by crop, where relevant (bottom centre)
- The area for the crop in the continent context (bottom right)
- To show the data behind the graphs: Right mouse click
- Questions? Please contact helga.willer@fibl.org
- More information about Power BI on Wikipedia
 tap and then scroll down to the Add to Home Screen command.